Data Analytics Use Cases
Our Work.
Modern video design services
Data Analysis Portfolio
Our team specializes in delivering exceptional data visualization and analysis services that empower your brand to make data-driven decisions. We focus on transforming complex data into clear, actionable insights through compelling visuals that not only look impressive but also drive business growth. With over 10 years of experience, we provide creative and professional data solutions that work seamlessly across all platforms.
We specialize in interactive dashboards, automated reporting, data storytelling, and advanced analytics. Whether you’re uncovering trends, optimizing performance, or communicating insights, we’re here to bring your data to life with visuals that resonate with your audience and deliver measurable results.
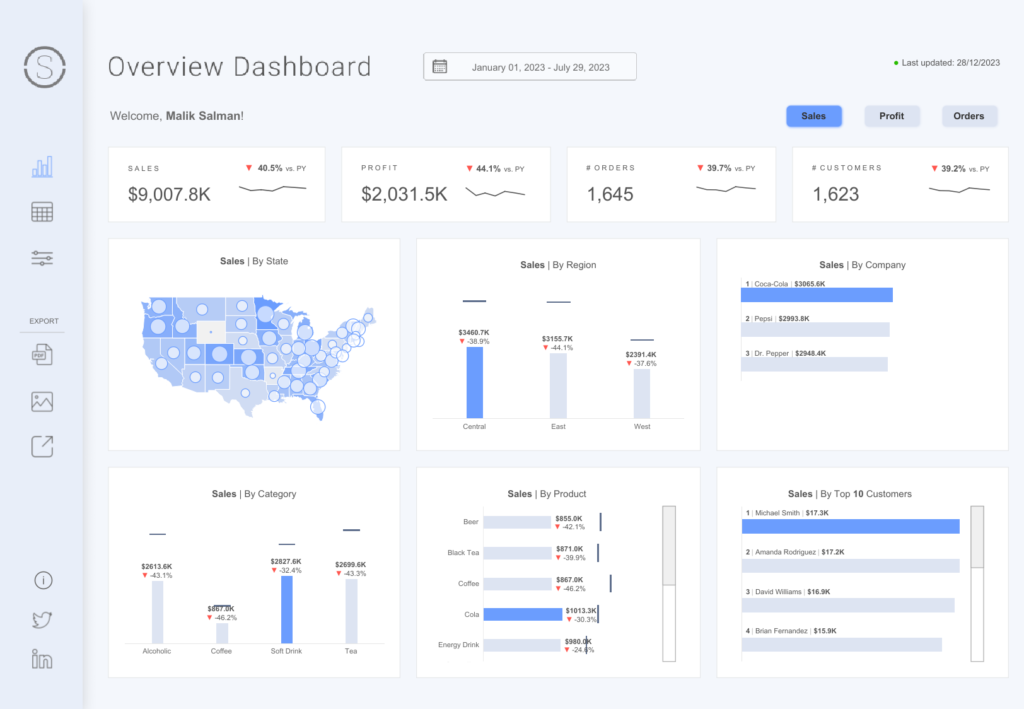
Sales Dashboard
The Sales Dashboard we developed empowers businesses to track their performance, optimize strategies, and drive revenue growth. Built on the robust integration of SQL and Power BI, this solution delivers real-time insights and actionable analytics in a sleek, interactive interface.
Key features include:
- Comprehensive Sales Analysis: Detailed breakdowns of revenue, product performance, and customer behaviour trends.
- Custom Reporting: Tailored reports that meet specific business objectives, enabling data-driven decision-making.
- Interactive Visualizations: Intuitive graphs and charts that bring data to life and simplify complex datasets.
- Automated Updates: A seamless data pipeline that ensures the latest sales metrics are always at your fingertips.
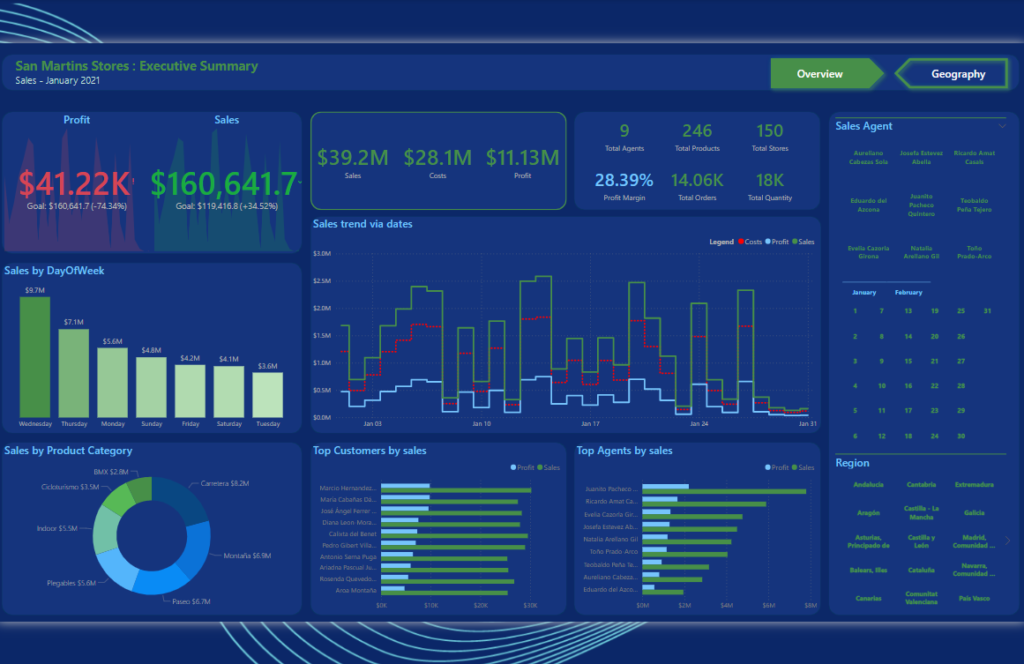
Store Overview
The Store Vverview Dashboard we developed empowers businesses to track their performance, optimize strategies, and drive revenue growth. Built on the robust integration of SQL and Power BI, this solution delivers real-time insights and actionable analytics in a sleek, interactive interface.
Key features include:
- Comprehensive Sales Analysis: Detailed breakdowns of revenue, product performance, and customer behaviour trends.
- Custom Reporting: Tailored reports that meet specific business objectives, enabling data-driven decision-making.
- Interactive Visualizations: Intuitive graphs and charts that bring data to life and simplify complex datasets.
- Automated Updates: A seamless data pipeline that ensures the latest sales metrics are always at your fingertips.
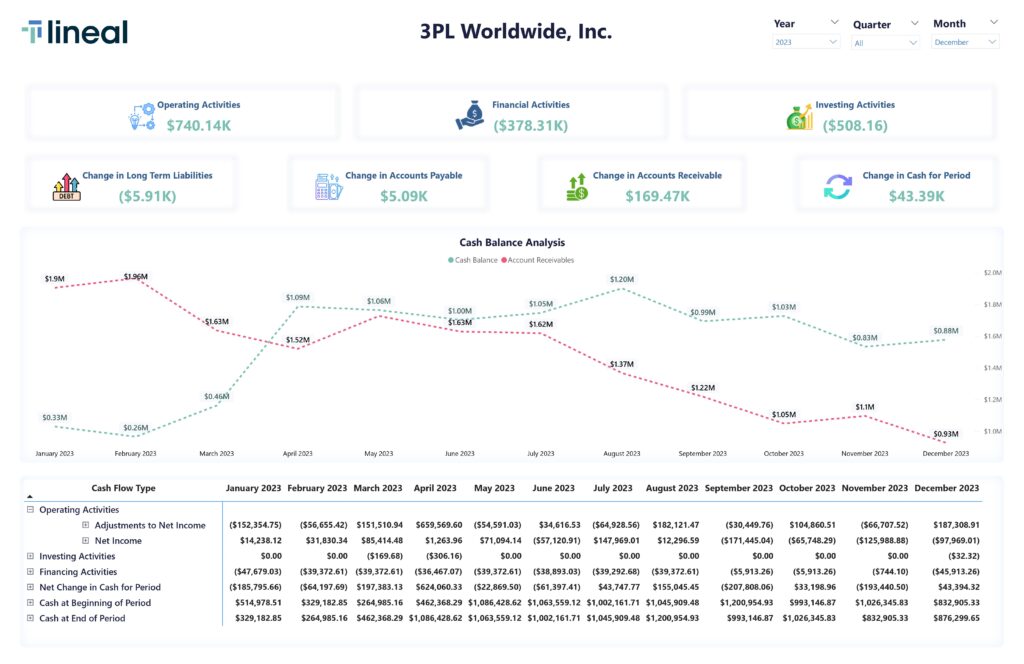
Financial Dashboard
We partnered with Lineal to create a dynamic Financial Dashboard that transforms their business data into actionable insights. Designed and developed using Power BI, the dashboard integrates seamlessly with Microsoft Dynamics 365 Business Central, providing a real-time view of key financial metrics.
The dashboard offers a comprehensive analysis of revenue, expenses, profit margins, and cash flow, empowering the client to make data-driven decisions with confidence. Custom visualizations and intuitive filters allow the team to drill down into specific business units or periods, ensuring they stay on top of financial performance.
Services Provided:
- Integration: Microsoft Dynamics 365 Business Central to Power BI
- Data Modeling: Creating optimized data pipelines for seamless performance
- Analysis: In-depth financial insights and reporting
- Visualization: Interactive dashboards for enhanced decision-making